Leaping Past Observability with AIOps
- Sandra Byrd & Nash Deel
- 7 min read
As a leading digital financial services company, Ally is relentlessly focused on providing the best experiences for our customers. This requires us to obsess over platform availability and resiliency. Given the scale of our digital platforms, and the focus on continuous improvement, we’ve been on a journey to apply artificial intelligence (AI), machine learning (ML), and automation. Enter AIOps — artificial intelligence operations — the use of machine learning concepts to enhance IT operations. AIOps has become integral to how Ally proactively identifies and resolves emerging threats and vulnerabilities. Gartner research underscores this idea by finding that “[t]here is no future of IT operations that does not include AIOps. This is due to the rapid growth in data volumes and pace of change (exemplified by rate of application delivery and event-driven business models) that cannot wait on humans to derive insights.”
The Challenge: Effectively & Efficiently Identify Emerging Issues
Like most companies, Ally has several tools and teams who are responsible for ensuring our digital experiences are available for our customers. Prior to implementing AIOps, teams would need to use multiple tools to monitor and react to potential issues. This multi-system monitoring environment impacted our ability to identify emerging issues effectively and efficiently — tracked through key metrics such as mean time to assign (MTTA), mean time to detect (MTTD), and mean time to remediate/resolve (MTTR). In short, often it was taking us longer to find the issue than remediate it. Therefore, implementing an AIOps solution was the obvious next step to be better in our monitoring and observability practices. To do this we approached it through three parts — establishing a standard operational taxonomy, onboarding applications, and automating manual alerts.
Part 1: Establishing a Standard Operational Taxonomy
Ally’s monitoring and observability program leverages AIOps frameworks and tools — specifically by focusing on the combination of machine learning, task automation, performance monitoring, and event correlations. As we began to evaluate numerous tools, we made sure to keep the human aspect at the forefront — how can we make it simpler for teams to quickly view and assess their space?
Once we stood up our AIOps platform, we configured individual integrations to each of Ally’s main monitoring tools to begin the alert ingestion process. After the tools were successfully feeding alerts into the platform, it was time to start digging through our alert data.
Since no AIOps platform is going to magically fix our observability problems, we began evaluating the data and bucketing our key values together in the alert payloads to establish consistent terminology and context. This allowed our current and future AIOps tools to logically understand the relationships between our alerts, essentially putting all our tools on the same page. For example, one application’s alert may refer to the server as “host” while another tool refers to the server as “instance.” AI tools do not automatically know how to differentiate between these varying alert field names, so our team leveraged custom tagging to add context to monitoring events.
Ally AIOps engineers configured custom tags to bucket individual alert tags together. Using the previous example, we created a custom tag to bucket both “server” and “instance” under a normalized tag called “host”. This allowed us to set up our data models on a single field as opposed to multiple fields searching for the same information. With clean alert data flowing in, we could tie our alert data to our configuration management application to further enrich the alert data with Ally’s infrastructure topology.
Not only were our new custom tag standards helpful in data management, but we could now define automated correlation patterns, which relate alerts together. The ability to group alerts from multiple monitoring tools triggering on the same server, for example, is an excellent example of providing that full overview of alerts. Giving teams who are triaging an issue a single, high-level incident to review as opposed to reviewing alerts within multiple monitoring tools significantly reduces MTTD. Defining these buckets and setting standards around that process set us up for a successful application onboarding effort.
Part 2: Onboarding Applications
After establishing connections and integration practices with our main monitoring tools, we embarked on an aggressive effort to onboard all key applications at Ally. This meant we had roughly 200+ applications to onboard in a matter of six months. To ensure rapid and quality execution — we developed an automated, supportive engagement model — creating clear activities and owners around intake, assessment, and implementation. Part of our success was our shift-left approach, aligning teams to one of our AIOps engineers from the beginning. This enabled hands-on assistance to each team we onboarded and allowed us to walk app teams through the alert ingestion process, uncover any siloed monitoring tools being utilized, and ensure they define their alerts in our standard format — helping us to not only onboard them, but suggest areas for improvement in their observability space.
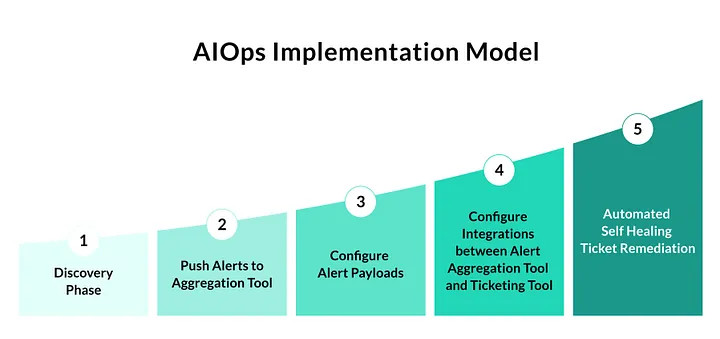
This hands-on approach allowed us to uncover many instances of manual efforts being performed by teams where our AIOps pipelines would provide an immediate, automated solution. To standardize and visually represent our AIOps envisioned scope at Ally, we established an AIOps implementation model, as detailed in the image below. This model enables incremental value-add as teams work to further mature their AIOps processes by implementing actionable alerts and automating manual workflows wherever possible and reasonable.
Part 3: Automating Manual Actions
To get the full benefits of an AIOps platform, we deployed automated pipelines within our monitoring and observability space. The typical workflows left teams constantly monitoring dashboards and logs for issues, so we wanted to prove out a full end-to-end solution where AIOps can make an impact. We initially worked to derive a subset of service latency alerts that correlate together so when at least two different services trigger alerts, an incident ticket automatically opens and populates the form with information from the alert payloads. This automates a previously manual process from end-to-end with no need for manual intervention. Below is a workflow diagram of one of our many AIOps automated pipelines.
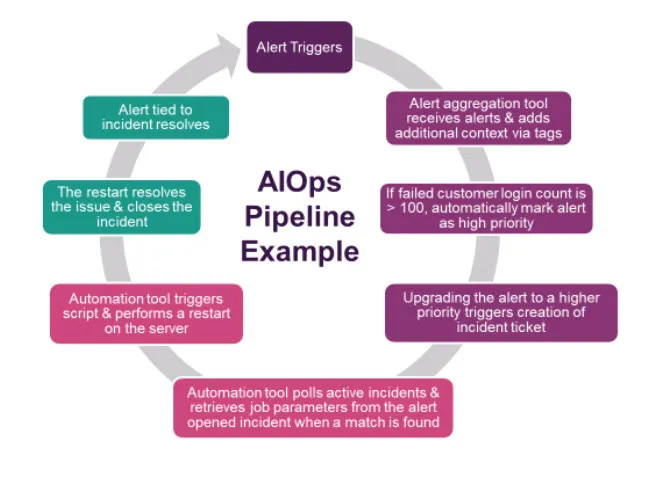
Using the above as our proof of concept, we circled back with each of our key application teams to determine what manual steps they took when critical alerts trigger on their applications to derive use cases in other spaces. Through this process, we were able to build out 100+ smart ticketing pipelines, eliminating manual correlations and ticket creation processes. The reduction in manual effort improved our operational metrics, while giving time back to our engineers to focus on building great software. It was a win for everyone!
This approach has been successful at getting teams onboarded and furthering their automation journey. They can directly apply our pipeline capabilities to their own use cases, whether it be automating simple tasks, like assigning priority and support group tags based on failed customer interaction count in the alert or enriching their existing alerts with tags that act as parameters when passed over to our automation tools — triggering automated remediation scripts on the alert objects.
Retrospective: Using Incidents to Make Us Better
There are many opportunities to identify ways to improve our monitoring and observability program. A key one is reviewing lessons learned and opportunities after a live incident has occurred. We refer to these as “incident postmortem retrospectives.” These weekly retrospectives include a review of major and minor incidents and discussion on where and how AIOps can improve our resiliency and security posture. With this process, we are continuously working with teams to close the gaps in our monitoring and observability space. There have been many cases where our pipelines save upwards of 10 minutes in MTTD metrics, and we’re able to apply that logic within our AIOps tools, further optimizing our ecosystem.
Our retrospective process helped us identify issues with alert configurations, mostly due to inefficient processes. By working with these teams through our updated AIOps model, we are able to make our monitoring tools and alerts useful and ensure teams are getting real value.
Looking Ahead: Targeting Self-Healing
As we continue to look forward in our AIOps journey, we are consistently looking to raise the bar with our tools. Making this shift from “reactive” monitoring to “proactive” and “predictive” monitoring requires us to continually seek out automation opportunities and areas to improve. For example, we have implemented a direct integration between our AIOps platform and automation platform to trigger health checks and remediation scripts to bring us to that ultimate step of self-healing / self-remediation state of AIOps. Setting up smart ticketing workflows around alerts already gets us well within a < 5 minutes MTTD metric range, but once we begin triggering remediation scripts directly on alerts from our source tools, our team expects to see a significant drop in our MTTR metrics as well.
We are, also, actively working on enhancing our machine learning (ML) capabilities to help us further assist in triage through indication of the potential root cause change for alerts and incidents. Receiving a ticket that already indicates it may have been caused by an implemented change request provides an immediate direction for our teams to investigate during triage. This will tie into our existing efforts in reducing the incident impact detection time and allow us to have quicker response rates as we steadily progress teams to that full end-to-end AIOps workflow in their monitoring and alerting environment. A strong partnership with our change management team is key to making progress in this effort.
At the end of the day, we want to set teams up for success and ensure they have full coverage across all the monitoring platforms they utilize. Providing an AIOps platform to house all of this data in a single view and a proactive, supportive engagement model to help manage it has made a tremendous impact on both the number of incidents we manage as well as how quickly those incidents are handled.
Interested in joining Ally's team of talented technologists to make a difference for our customers and communities? Check outAlly Careersto learn more.